Variable sowing or planting? Variable spraying? You can do that too with WatchITgrow!
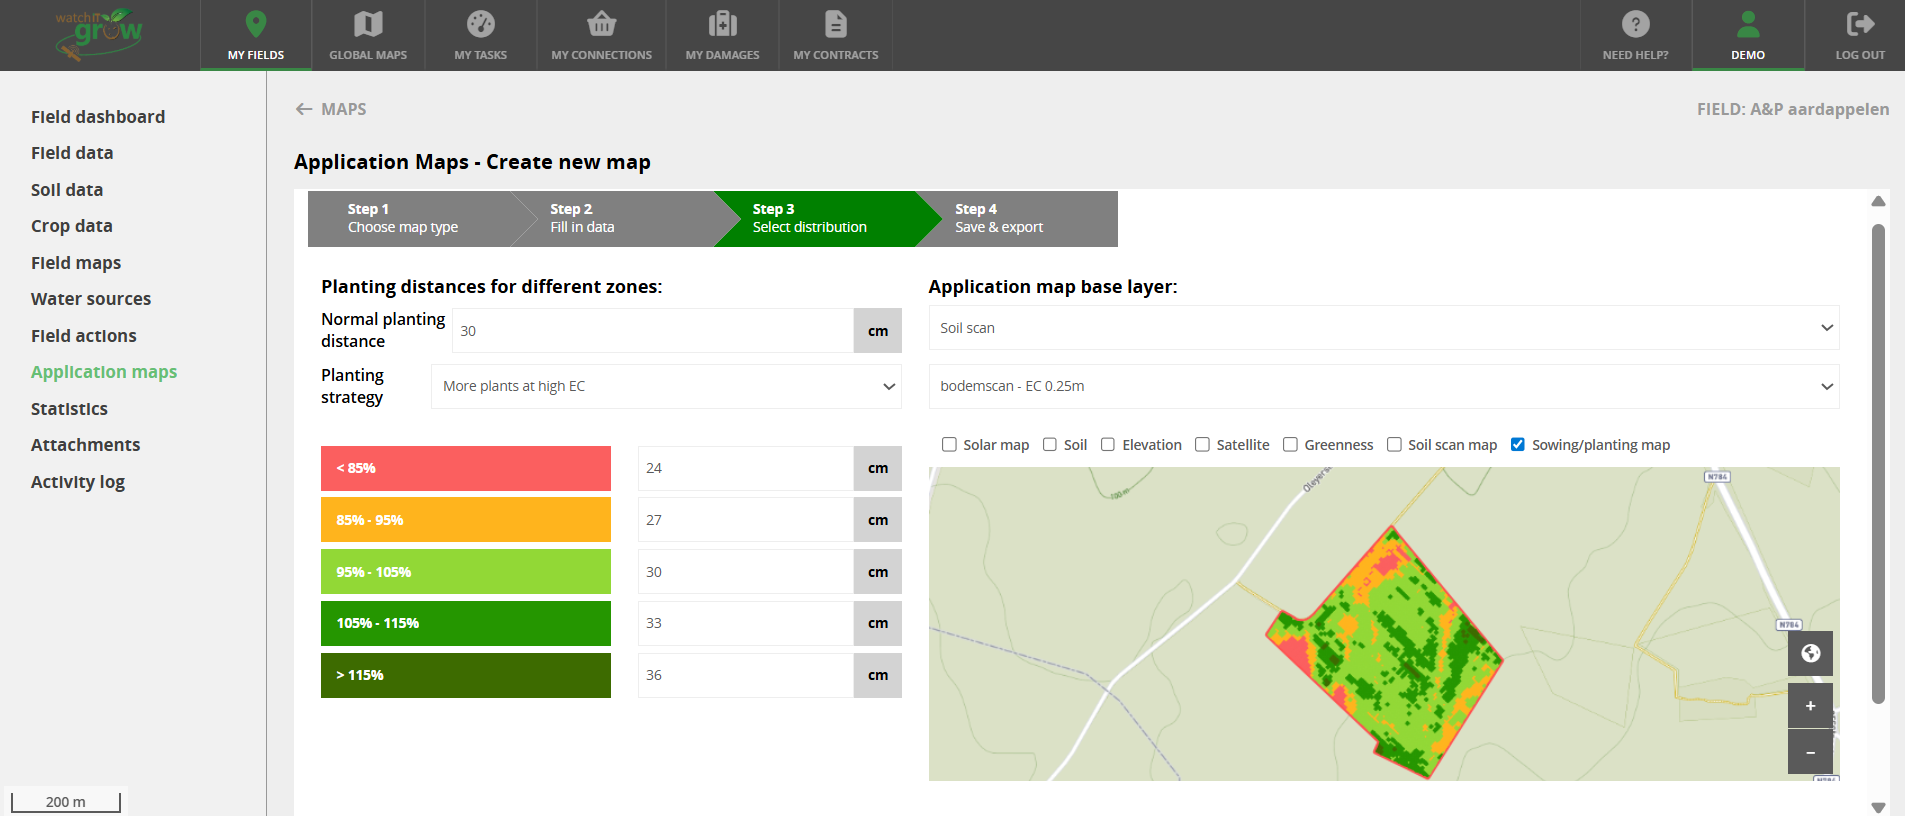
Precision farming gets even easier. In WatchITgrow, you can now create not only application maps for variable planting, fertilisation and irrigation, but also spray maps. What’s more, you can now use your own soil scans and drone imagery as a base layer.
Below you can find an overview of the available base layers per application:
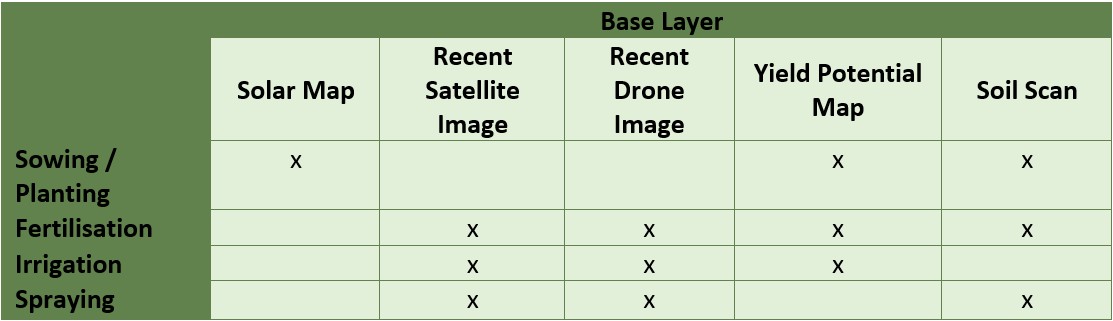
- Sowing or planting: adjust the sowing or planting density or the spacing based on shadow zones within your field, soil parameters (EC) or variations in crop growth from previous years.
- Fertilisation: adjust the fertiliser dose to zones with better or poorer growth, or to specific soil characteristics.
- Irrigation: provide extra water in zones where the crop growth is lagging behind.
- Spraying (weed control, crop protection, growth inhibition, haulm killing): apply targeted treatments and avoid waste by adjusting the product dose to the level of crop or weed growth.
This extension was developed within the ADaM & PreciLa project with support from Interreg Flanders-Netherlands and the European Union. The project aims to bring technical innovations and practical demonstrations of Precision Agriculture (PreciLa) closer to growers, both in Flanders and the Netherlands, through improved Agri-Data Management (ADaM).

Manage grassland more effectively with WatchITgrow
As part of the VLAIO GrasSat project, a new simulation tool for grass biomass has been added to WatchITgrow. You can open the tool via the "Field dashboard" by clicking on "Biomass" in the the left-hand menu.
Based on weather and soil data, as well as the fertilisation and mowing data you enter yourself under "Field actions", WatchITgrow generates a graph showing the modelled grass yields. In the visualisation, you will see:
- Blue dots: the entered fertilisation dates
- Red dots: the recorded mowing dates
- Green curve: the modelled evolution of grass biomass throughout the season
- Bar charts at the mowing dates, showing:
- Dark green bar: estimated harvested biomass
- Light green bar: the stubble
- Orange bar: an estimate of the crude protein content
Learn more about the underlying model
For more information about the GrasSat project, please visit the website of the Province of Antwerp or Inagro.

Switching from traditional to water-level-controlled drainage? Calculate the impact!
In WatchITgrow, you can easily click through to the Waterradar under "Global maps". A suitability map and a calculation tool for water-level-controlled drainage in Flanders were recently added to the Waterradar as part of the VLAIO LA project OP-PEIL.
Wondering whether water-level-controlled drainage could be a viable option for your area or field? You can get an immediate initial assessment using the Water-Level-Controlled Drainage Suitability Map, which you’ll find under "Scenarios and Maps". When you click on a field, the overall suitability score appears, along with the scores for the underlying factors: soil texture, drainage score and slope.
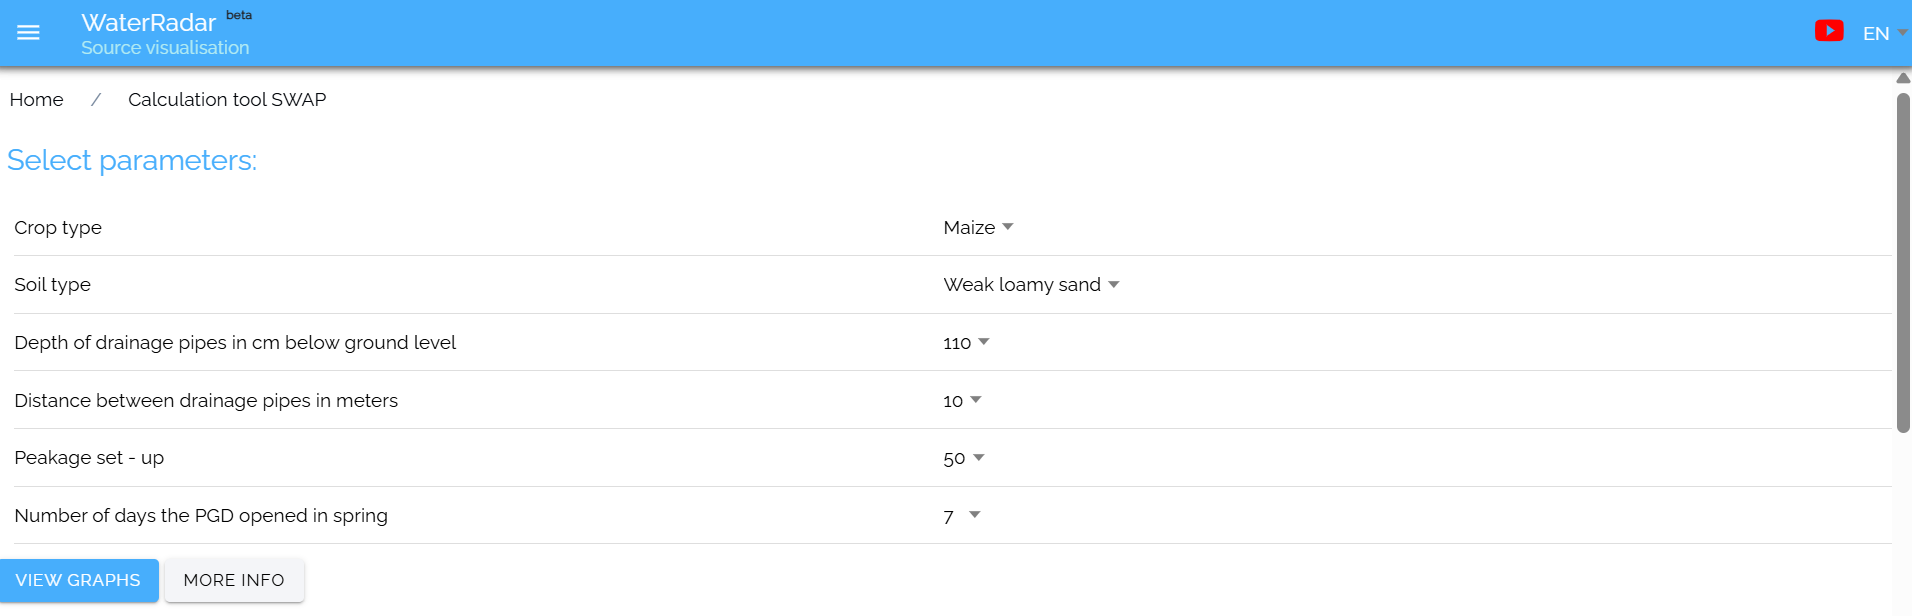
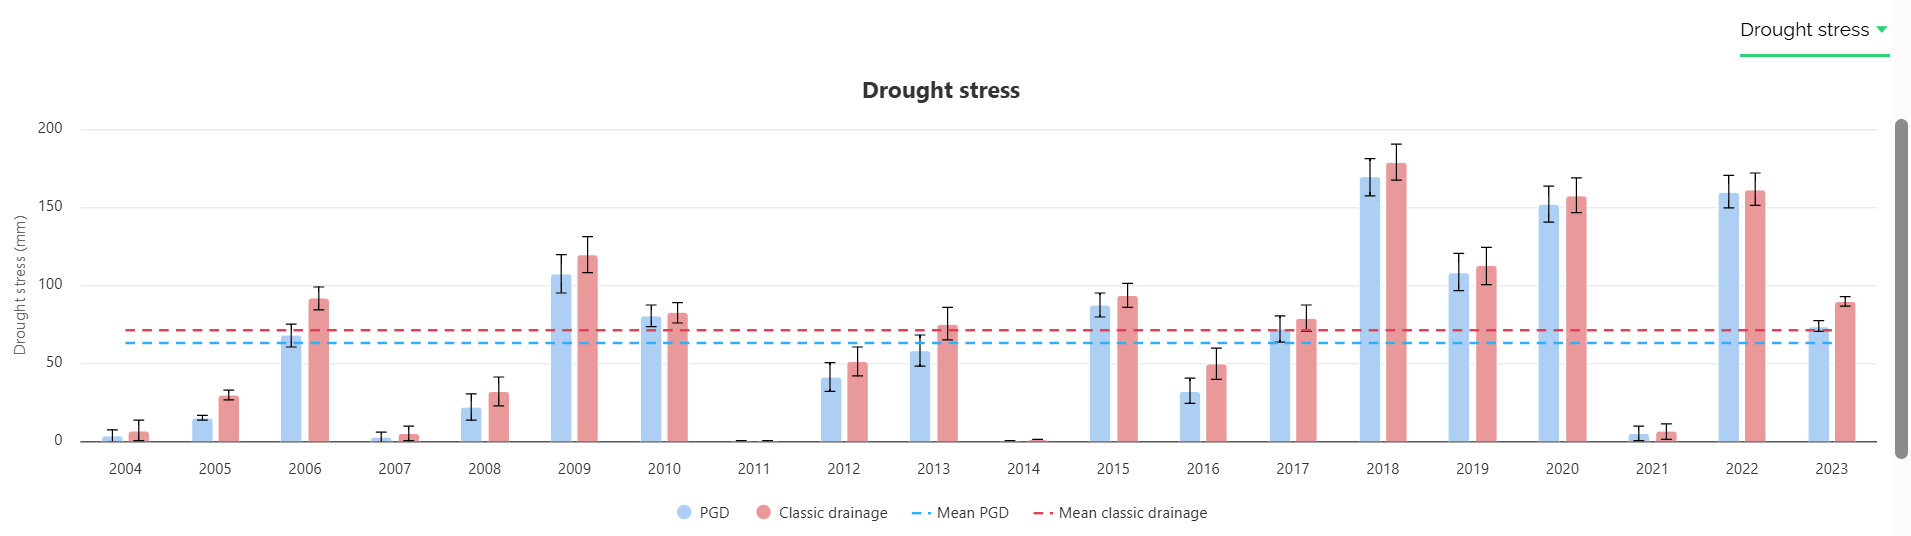
The SWAP calculation tool allows you to quickly and accurately assess the impact of switching from conventional to water-level-controlled drainage on factors such as crop transpiration and the water system.
To account for the influence of climate variation, the tool simulates results over a period of 20 consecutive years (2004-2023). You can visualise the results for maize, potatoes, grassland and cauliflower. You can also set various parameters yourself:
- Soil type
- Drainage system: depth and distance between drainage pipes
- Water level control: water level setting and the number of days the system is active
Learn more about the calculation tool

Monitor your flax and hemp fields in WatchITgrow
With the completion of the Flaxsense 2.0 project at the end of 2025, WatchITgrow is fully prepared for a wider roll-out within the flax sector. Thanks to close collaboration with the Flax and Hemp Sector Association and support from VLAIO, numerous features have been added and refined over the past few years, specifically tailored to the needs of flax growers.
You can now digitally log specific field operations such as harvesting, retting, and turning in a field record. Thanks to the integration of a flax growth model, crop height and growth rate are automatically estimated, whilst the growth stage is calculated based on the temperature sum. In addition, you can use the platform right from the drafting of a cultivation contract via the handy contract module. Finally, the new yield sheet helps you track the yield per quality class more accurately.
Learn more about Flaxsense 2.0
In addition, we have also made the necessary adaptations to WatchITgrow for hemp monitoring. For hemp as well, it is now possible to register the typical field activities. You can now efficiently maintain all information in customized field records and yield sheets.

From now on, register your plant protection products digitally with WatchITgrow
From 1 January 2027, it will be mandatory in Flanders to record the use of plant protection products digitally. Using the green “+Field actions” button in the Field dashboard, you can easily add information about “Crop Protection”. There, you can note which product you have applied, when and in what dose (with automatic linking to Fytoweb), the crop growth stage at the time of application, and any additional comments.
Is a contractor carrying out the crop protection work? No problem! Share your fields in WatchITgrow with your contractor. They’ll record the work, and you’ll be able to easily find the details in your Field dashboard.
All information entered regarding field operations and observations is automatically compiled into a handy PDF report: the “digital field record”. You can download this sheet by clicking the green “Print” button in the Field dashboard and then selecting “PDF”.
You can now also find the details you have added regarding the previous crop or cover crop in the digital field record, as well as the preparatory work carried out on your plot.

The WatchITgrow team wishes you all the best for a successful season!
If you have any questions about WatchITgrow or suggestions for improving the platform, please do not hesitate to contact us.