Dry, drier, driest...
Months of drought are bringing serious challenges to agriculture. Over the past weeks, you've probably noticed drought warnings appearing for many of your fields in the field list. But ho w much rain has actually fallen on your fields? What's the current precipitation deficit? You can easily find this information in the Statistics section of your WatchITgrow field dashboard.

Irrigation?
Can you irrigate your fields? Great!
In WatchITgrow you can not only record when and how much you've irrigated, but also identify which fields need it most. We use the AquaCrop model, optimized in recent years for potatoes, spinach, and cauliflower, to help determine this. In 2024-2025, this irrigation support tool was also integrated into Care4Growing and the app of the growers' cooperative Inero.
For more details, check out this news release from Inagro (only in Dutch).

Looking for irrigation water?
WatchIITgrow has you covered thanks to its link with WaterRadar. Under 'Water Sources' in the field dashboard, you can see if treated wastewater is available near your field and whether it's suitable for your crops.
Curious? Learn more here.

Drought damage?
Growers who have taken out a Broad Weather Insurance Policy with KBC can report any crop damage via WatchITgrow.
More information about KBC's Weather Insurance can be found here.

Toward a more sustainable agriculture
For several years, WatchITgrow has helped you monitor crop growth and manage your fields more efficiently. Now, we're taking it a step further. In addition to your fields, we're also providing a clearer view of their surroundings.
What's new?
For Flanders, WatchITgrow now features additional map layers that help you better understand and manage the landscape around your fields. These include:
- small landscape features (like hedgerows, tree lines, ...)
- water surfaces and waterways
- vulnerable natural areas
- permanent grasslands
Why include this data?
As a farmer, you know your land better than anyone. These new layers don't add obligations, they offer better insights. That way, you can make the right decisions at the right time, in a way that fits your farm and the environment.
We remain committed to a practical and usable tool, developed by and for farmers.
We're also conducting studies to understand the positive effects that agricultural practices can have on the environment, for example, the value of maintaining small landscape features.
Want to see what these new layers look like? Explore the 'Field Maps' section to discover what's happening around your fields.
Together we're working towards a future-oriented agriculture.

What else can you expect?
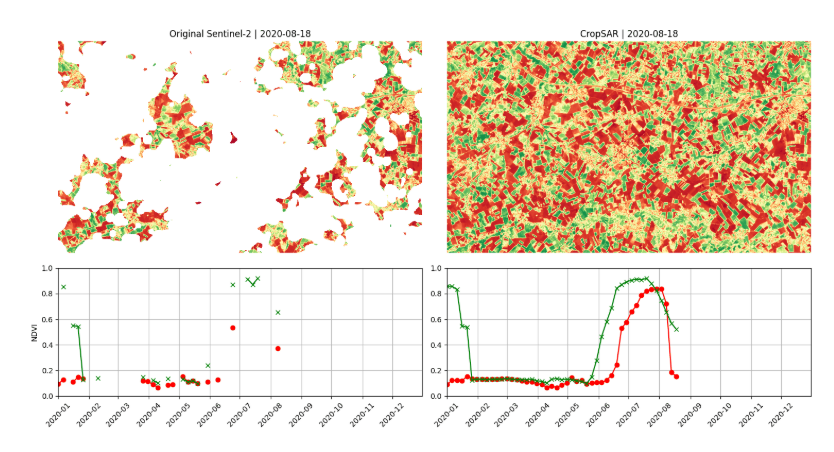
Satellite images of your fields - even when it's cloudy? Soon possible!
In June, we're launching the integration of CropSAR 2D. This technology, which combines optical and radar satellite images to estimate your field's greenness in cloudy conditions, has already been used to generate growth curves in WatchITgrow.
What's new is that we can now also generate images using this technology. From now on, you'll receive a new image of your field every 5 days!
Need an up-to-data satellite image to check variability or create a task map? We've got you covered!
Check out the power of CropSAR 2D in this animation.
We're here to assist you. if you have any questions or suggestions regarding WatchITgrow,
please don't hesitate to contact us.