Fertilize grassland at the right time based on the temperature sum
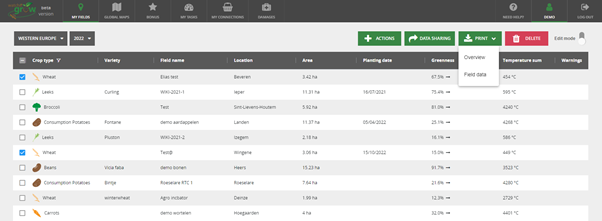
In the field list, in addition to the greenness, you will find now the temperature sum for all your fields.
The temperature sum or T-sum is the sum of the average daily temperatures above 0 degrees since January 1.
You can use the T-sum for example in spring, to estimate when you need to give your grassland a first dose of nitrogen (fertilizer).
In most cases, this takes place at a T-sum between 180 and 250 degrees, depending on the envisaged production, and taking into account the type of fertilizer and the soil temperature.
WatchITgrow and KBC work together to ensure efficiency in case of crop damage
The changing climate is creating many challenges (water scarcity, (thunder)storms, flooding,...) in agriculture. With a private weather insurance, you can insure your fields against crop damage caused by extreme and adverse weather conditions.
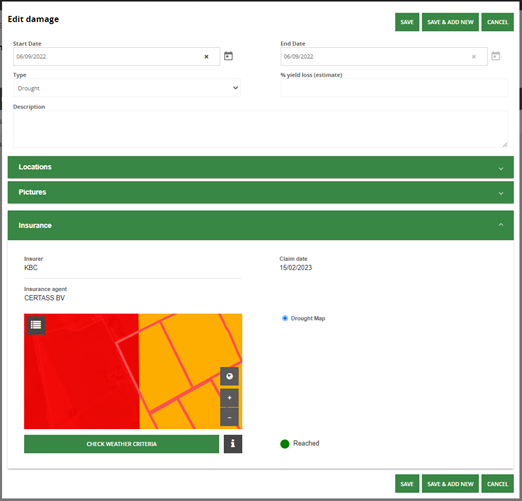
WatchITgrow growers who have a weather insurance for their crops with KBC, can now report the damage via WatchITgrow. Thanks to the cooperation with DjustConnect, we automatically retrieve your insured fields from your field declarations to the Flemish Government.
To report damage, you go to your field in WatchITgrow and fill in the damage form. You can even indicate the exact location of the damage in the field or upload photos.
Moreover, you can immediately check whether your damage is eligible for compensation.
Everything filled out? Then send the form via WatchITgrow to your KBC Insurance agent who will follow up your claim.
Simple and efficient!
New possibilities for flax monitoring
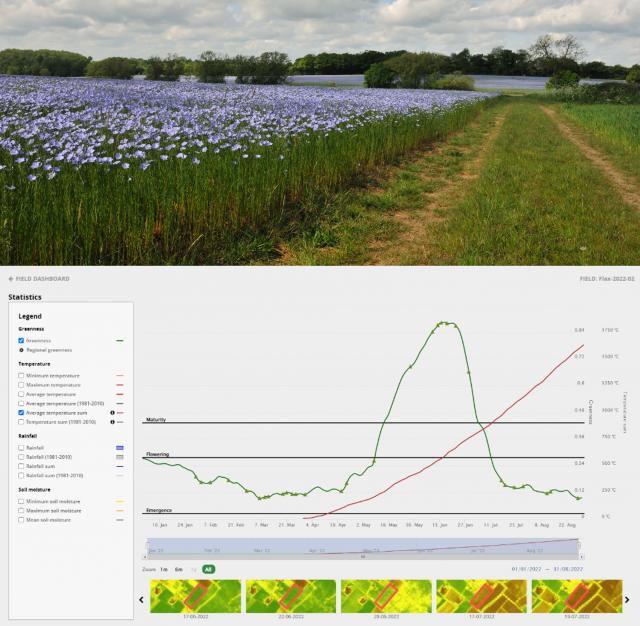
With the support of VLAIO and the Belgian flax association, WatchITgrow has been adapted for flax monitoring.
Through the temperature sum you get an idea of the growth stage of the flax crop.
Furthermore, you can add information about the typical activities on a flax field such as the pulling, turning and baling of the flax.
After processing, you can also enter the yield of the flax by quality class.
In addition we are currently developing practical tools that will give you advice on the optimal sowing date and on the application of growth inhibitors in the flax.
Results to look forward to!
Click here for more information about the Flaxsense 2.0 project.
More efficient planning of field visits
Via the 'Edit mode' you can choose which info you want to see in the field list.
Moreover, you now also have the possibility to add a 'Label' to your field to give e.g. a score to your fields, or add the cultivation area and then filter and/or sort on that.
Useful when planning field visits!
By the way, you can easily print the filtered and sorted list and take it with you.
Get to know your field better thanks to yield potential maps
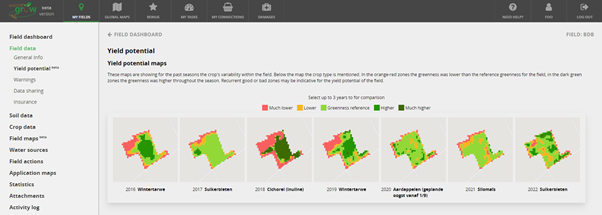
Are there zones within the field where the crop performs better or worse? Do those zones recur year after year? Or only in dry conditions? Or with certain crop types?
You can easily check this with the yield potential maps in WatchITgrow!
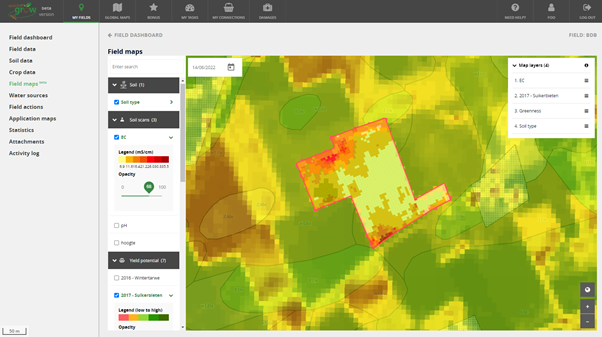
Enter your field and check the variability over the past 7 seasons.
By the way, you can also use the yield potential maps as a base layer for creating tasks maps for variable rate fertilization and irrigation.
Visualize and compare various images and maps of your field
What is causing the variations within your field? That question must be answered before you can take targeted measures.
In WatchITgrow you can compare satellite images, yield potential maps and soil maps, at a glance.
If you have a soil scan, drone images or yield maps from an AVR potato harvester, you can easily add them to WatchITgrow and compare them with the data that WatchITgrow already has available.
